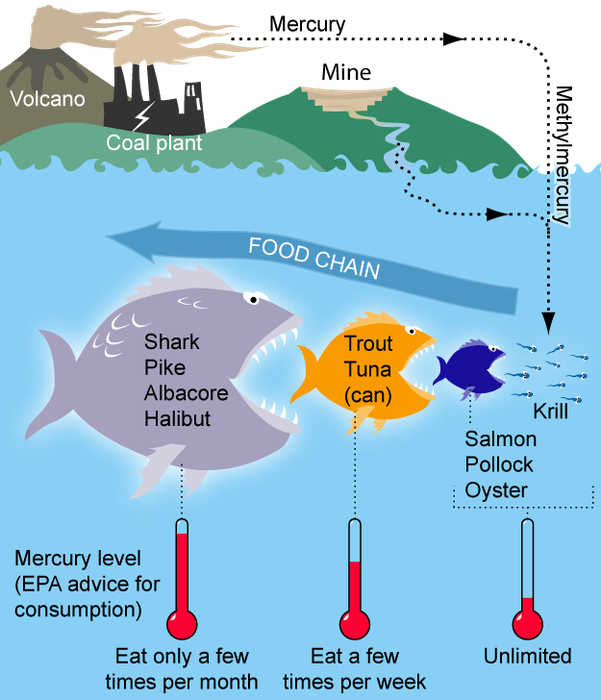
How Does Mercury End Up in Your Food?

Mercury from coal fired power plants and other sources travels through the atmosphere and water. Some is changed to methylmercury, which can enter the food chain to be concentrated at each step on that chain. Large old predators like sharks and pike, or scavengers like halibut, hold the greatest concentrations of mercury. To produce the summary of advice on consumption, we looked at a wide variety of data sources, summarized below:
- A) Extensive analysis of mercury in fish by Alaska dept. of Epidemiology. Data on p. 12.
- B) Poster summarizing mercury levels in Pike in W. Alaska
- C) Method for calculating how much fish of different types you should eat (Alaska).
- D) EPA measurements of mercury in non-commercial fish (graphic).
- E) Data on mercury in fish from the Alaska dept. of the Environment.
- F) EPA discussion of mercury advisory, includes data on p. 3.
- G) FDA data on mercury in fish
- H) Krill supplier that reports mercury concentration.
- I) Washington Post article on EPA mercury guidelines (includes suggested limits on exposure)
| Kind of fish | Mercury (ppm) | Mercury (micrograms per serving) | Max servings per month | Source |
|---|---|---|---|---|
| Shark | 1.182 | 201 | 1.1 | A |
| Shark | 0.988 | 168 | 1.3 | G |
| Tuna (albacore) | 0.35 | 60 | 3.6 | I |
| Pike | .15-3.4 | B | ||
| Pike | 0.35 | 60 | 3.6 | D |
| Pike | 0.35 | 60 | 3.6 | F |
| Pike | 0.152 | 26 | 8.2 | E |
| Halibut | 0.122 to 0.950 | A | ||
| Halibut | 0.325 | 55 | 3.9 | A |
| Halibut | 0.217 | 37 | 5.8 | E |
| Lake Trout | 0.303 | 52 | 4.1 | A |
| Rainbow Trout | 0.21 | 36 | 6 | A |
| Trout | 0.072 | 12 | 17.4 | G |
| Tuna (canned, light) | 0.12 | 20 | 10.4 | I |
| Tuna (canned, light) | 0.112 | 19 | 11.2 | G |
| Crab | 0.06 | 10 | 20.9 | G |
| Krill | 0.05 | 9 | 25.1 | H |
| Pollack | 0.045 | 8 | 27.8 | E |
| Pollack | 0.041 | 7 | 30.6 | G |
| Salmon | 0.04 | 7 | 31.3 | A |
| Salmon | 0.027 | 5 | 46.4 | E |
| Salmon | 0.014 | 2 | 89.5 | G |
| Oyster | 0.013 | 2 | 96.4 | G |