Climate Footprint of CTL
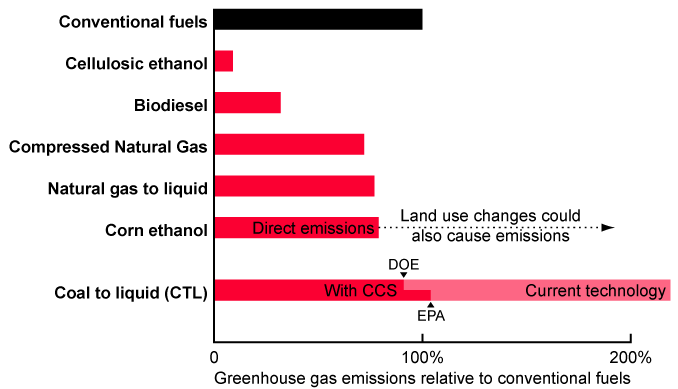
The process of producing liquid fuels also burns fossil fuels, compounding greenhouse gas emissions. Several analyses have been done looking at the emissions of different fuels, the most comprehensive by the EPA. Recently the EPA has updated some of their analysis, which we have not yet incorporated into this plot. The Dept. of Energy (DOE) has contested the EPA's analysis of emissions from CTL if "Low Carbon Coal" (CCS) technology were used. Both numbers are plotted, and all the numerical data is below.
- A) Original EPA analysis
- B) DOE analysis of CTL with CCS
- C) New analysis for renewables by EPA (not included in this data)
| Fuel | Emissions relative to conventional | Source |
|---|---|---|
| Cellulosic Ethanol | 9.1% | A |
| Biodiesel | 32.3% | A |
| Compressed Natural Gas | 71.5% | A |
| Natural Gas to Liquid | 77.4% | A |
| Corn Ethanol | 78.7% | A |
| CTL with CCS (EPA) | 103.7% | A |
| CTL with CCS (DOE) | 91% | B |
| CTL (EPA) | 218.5% | A |